Many traders claim their trades are “free money” or “risk free” when they move their stops to breakeven. But how true is this? Let’s take a quick look at some different scenarios.
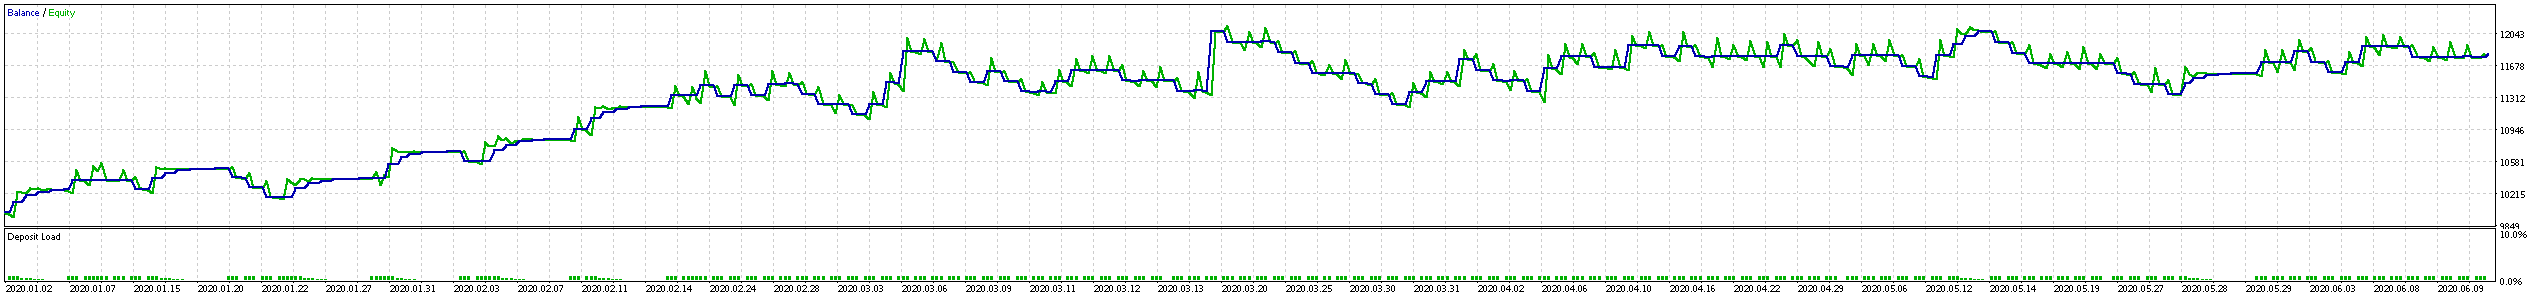
Here’s a curve from a bot that reverts to the mean, on H1, using a trailing stop from 25 pips, moving to breakeven, in steps of 25 pips:
And here’s the same without the trailing stop:
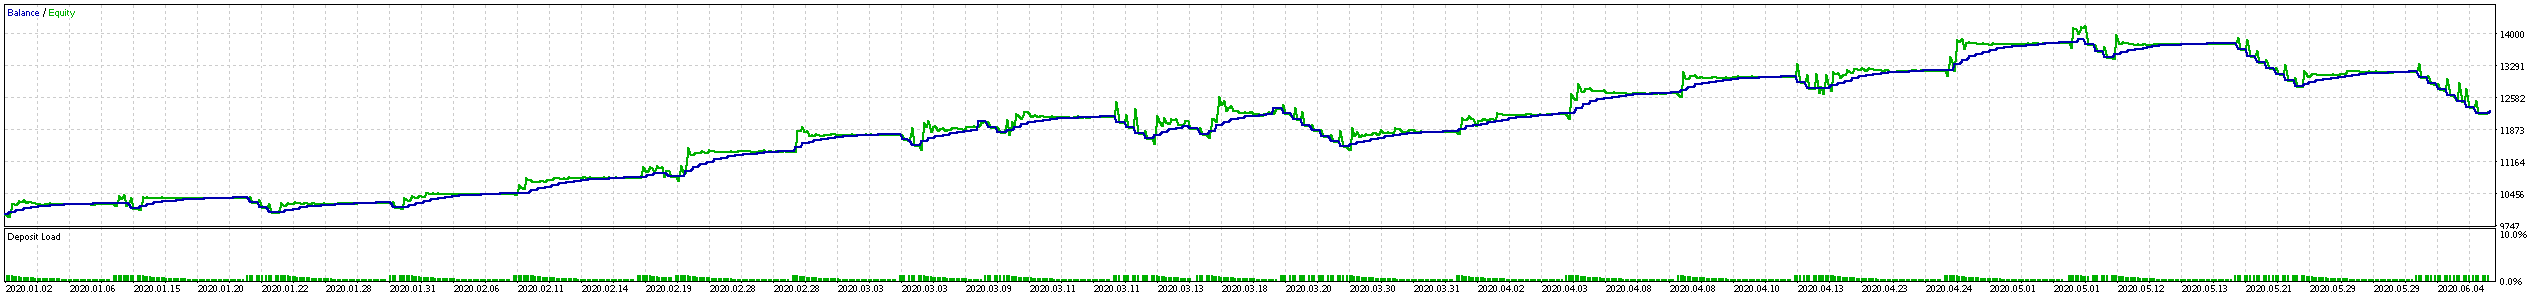
The equity curve is blue, the floating equity in green. This discrepency in this case is due to partial exits being used, keeping the position open while it still rises.
The end result is slightly higher on the test with no trailing stop. It also is a more volatile curve, peaking higher but reverting back to a similar endpoint as the trailing curve. Peak was 14k, if you can’t make it out from the image, compared to peak 12k with a trailing stop that moves to breakeven past 25 pips. Both end near 12k, with non-trailing a little higher. That’s after the first 6 months of 2020 on EURUSD.
But the potential upside is higher as trades are not limited past 25 pips. This is the general trend I’ve noticed over 1000s of backtests. Stops to breakeven will smooth your curve, but also limit your upside. The only way it could improve upside is remaining more consistent over time, or avoiding big swings. But in general you limit your upside while protecting your downside, depending on your strategy.
Another perspective
If we see risk as a factor of time, the first period of time before the stop is moved is at max risk, then when stop moves to breakeven, it is reduced to 0 in terms of risk of loss.
But that 0 ignores the opportunity cost of a tighter trade and it doesn’t average the risk from the start of the trade either, which would be at the midway point, not zero. So a more nuanced look would calculate the time-risk of the trade as well as the average opportunity cost based on trade history, much like the risk-free rate in the Sharpe or Sortino ratio calculations.
I hope that adds some colour to the subject. Feel free to share this around and report back any discussions that arise!