Trading currency strength divergences
Trading currency strength divergencesThere’s a lot of talk around supply and demand for individual pairs. Areas of supply and demand, liquidity zones and various other attempts to make sense of how price moves.
From my experiments with building my own strength indices and using them live for a year, I have seen more complexity involved than just the binary supply/demand dynamic.
As will seem obvious, price can either go up when the base is strong and the quote is weak (strong GBP, weak USD, makes cable go up), or down in the opposite conditions. Simple, demand for GBP in the first case and for USD in the latter. But what happens when GBP is strong but USD stronger? Or when GBP is flat or going down but USD pulling harder down? In the first case there is demand for both. The balance of demand, or strength differential, is really what counts.
If the strengths are correlated, as you often see on EURGBP or AUDNZD, with currencies in the same economic area typically, you will have ranging. The balance of demand is roughly equal, and oscillates around an average. When something causes demand to skew one way or the other, this is immediately reflected in the price and trending starts to occur. The strongest trends occur when one of the currencies has extremely low demand while the other has high demand.
You can have a trend that starts with, for example, GBP being strongest and so raising GBPUSD, then it falling and becoming less in demand, but USD falling harder, thus sustaining the trend. If you compare pairs at that point, and looked at, say, GBPJPY, you would see it rising first, and then falling if JPY was then stronger. The interplay between pairs is total, with every pair being dominated at root by the strength of the USD.

So when people ask me what pairs I trade, I’m tempted to say “just the dollar”, because in effect that is what is happening. But the real answer is “wherever the strength divergences are”.
But as alluded to above, even non-divergent strengths/demand, or sentiment, where they are on top of each other or moving in tandem, can be traded. As a range. If there is no sentiment differential, the demand for both will be the same or similar, switching from one to the other on whatever timeframe you are observing.
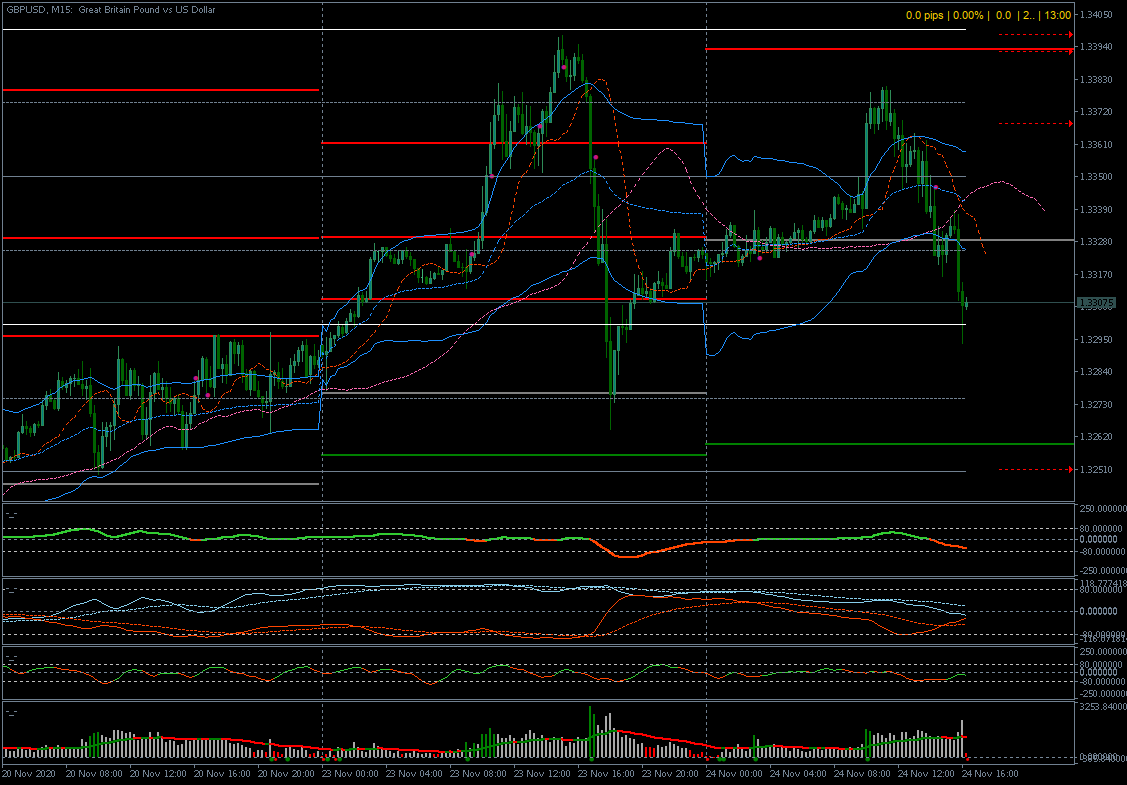
As you can see in the image above, the dollar is controlling when the GBP can run up, by dipping in strength. When it is flat, the GBP cannot pull up, it doesn’t have the demand to do it. In this situation at least. This causes the range. The strength indicator is the red/blue oscillator. The green/red ones either side are a summary of those lines on different timeframes.
Do majors control support and resistance?
One question I’m still working on resolving is whether or not the majors dictate where price turns. So if cable is approaching 1.33, and it has only bounced off it for the last year or more, when cable does get there in theory demand for the GBP should sink completely and no matter where the minors or crosses are, they should turn at that point too. Regardless of levels on their charts.
Unless – and this is where I’m uncertain – unless the individual pairs have independent supply/demand which forces it to push to its typical “levels” before turning. I doubt this, but it’s easy to verify for a small sample size.
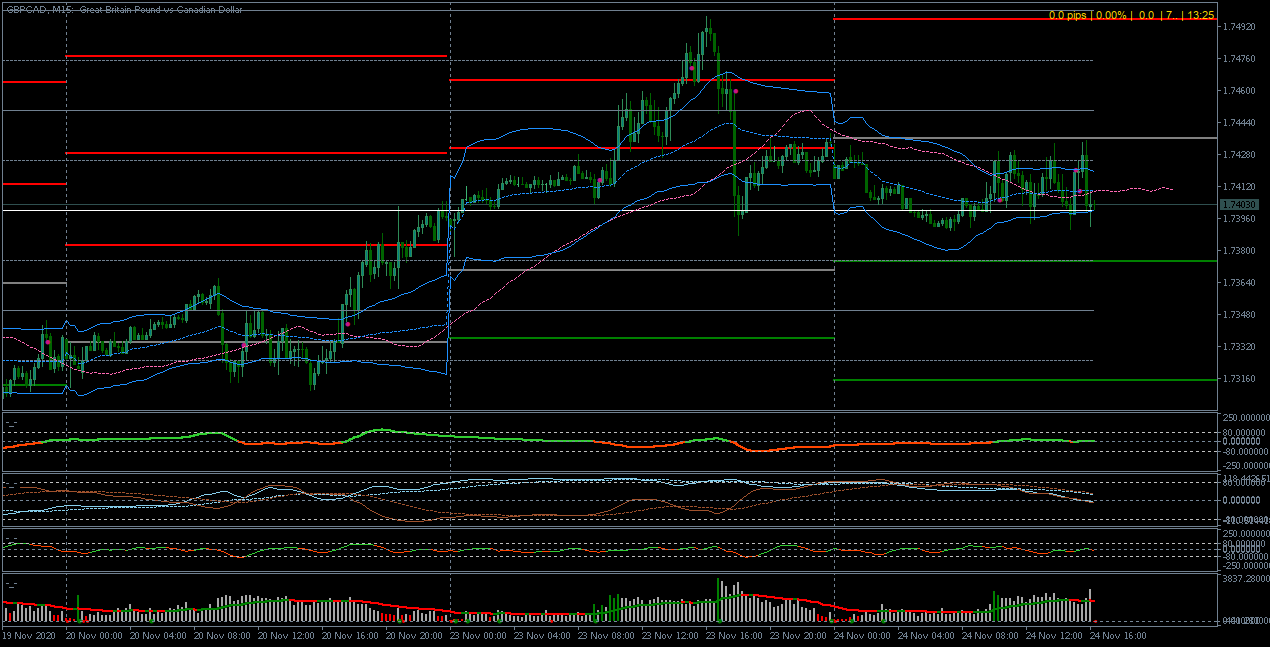
Here you see GBPCAD turn at 1.75 while GBPUSD turns at 1.33. The question is really whether the market for GBPCAD drove price up to 1.75 as a significant level, or whether the level is irrelevant and it just turned where GBPUSD did, having x times the market size and power to control GBP.
Can strength be predictive?
This depends over which time horizon. I would immediately say yes, in that at least for the average of the next few bars, while the strengths are diverged, you will get a trend in the suggested direction. The issue comes when you find out about the divergence too late - if it pops and then disappears, or if something happens to alter it immediately after it forms. But in general, there should be a predictive edge there. That’s why I’ve been so committed to working every angle of it.
To avoid joining too late, you can pick a fair price area (VWAP) or some average to work from, or you can consider price action and previous levels that were respected, wait for them to hit AND for price to turn, with divergence being highlighted across the pairs/strength indicators. That’s a likely reversal.
Also, there’s typically a trend going on some time frame, it just depends where you’re looking. If price is ranging on M5, zoom out and you will see you are at a shelf, consolidation, in an uptrend, for example. If you’re in a range on H1, zoom out to H4 or daily to find you’re slowly grinding up over weeks.
Proxies for strength indicators
Given that a strength indicator is only a cumulative moving average of multiple pairs relating to single currencies, you can just take something like the DXY to observe dollar strength (remembering that everything feeds off that anyway) or the Nikkei/S&P500 for indications of risk off/risk on sentiment.
You can look across the pairs (GBPJPY, EURGBP, GBPCAD etc.) to see the general movements and induce this yourself.
You can build your own indices in something like trading view, where you can invert the opposite pair to isolate the currency you need by doing 1/EURGBP to isolate the GBP component, then use + to average the pairs - GBPUSD+GBPCAD+1/EURGBP - and so on.
So I think theres still plenty to explore in strength divergences, but so far it’s proving a useful confirmation to trade decisions.
To see this being charted in more detail, check out the video below: